Difference between revisions of "Single Laue Image Analysis with LaueGo"
| Line 1: | Line 1: | ||
{{Incomplete}} | {{Incomplete}} | ||
This article describes how to analyze a single Laue image with [[LaueGo]]. | This article describes how to analyze a single Laue image with [[LaueGo]]. It is assumed that the LaueGo Panel is already up in [[IGOR Pro|Igor]], and the [[geometry parameters|geometry]] and the crystal lattice are both set up correctly (''See [[LaueGo#Basic Setup]] for instructions''). | ||
== Loading and Displaying an Image == | == Loading and Displaying an Image == | ||
* First of all, select the "Index" tab on the LaueGo Panel, and if you see a button named "Init Indexing package", push it. | |||
* To load an image to index, push the "Load Image" button, and select the image file that you want to analyze. | |||
* The loaded image is stored in Igor as a "wave" with its name derived from the file name, and can be seen within Igor's "Data Browser" window. | |||
* If an image window is closed, the data wave still exists in Igor. One can click the "View Image" botton on the LaueGo Panel to plot the image again. | |||
== Peak Search == | == Peak Search == | ||
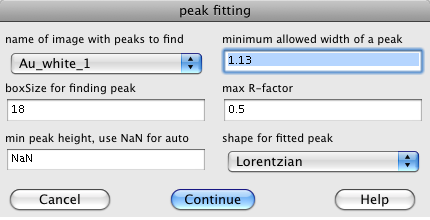
Next step you need to identify the peak locations. Push the "Fit Peaks" button. This first asks what peak fitting algorithm that you wish to use. The first choice is "Fit Peaks with External" this uses the same C program that is used on the cluster. The other choices use algorithms built into Igor. | |||
[[Image:peak-fitting_dialogue.png|frame]] | |||
* The image is a list of available images that you can fit. | |||
* The minimum allowed widht of a peak lets you set a minimum peak size. The 1.13 is fine for a Lorentzian, for a Gaussian peak use 0.2. | |||
* The boxSize should be big enough to include any peak. | |||
* The max R-factor should usualy be left at 0.5 unless you have very good or bad data. | |||
* The peak shape may be Lorentzian or Gaussian, the Gaussian works best. | |||
After the peak search has run, push button "±boxes" on topleft corner of the image plot. This button toggles the fitted peak boxes on/off. | |||
If you don't like the peaks that were found (either too few or too many), you can edit the list of peaks. To remove a peak from consideration draw a marquee around the offending peak, click in side the marquee to bring up a pop-up menu, and select "Remove Peak from pkList". To add a peak for consideration, again draw a marquee around the desired peak, click in side the marquee to bring up a pop-up menu, and select "Add Gaussian to pkList". Clicking on the "±boxes" button toggles the boxes around all fitted peaks allowing you see which peaks are being used. | |||
<br clear=all> | |||
== Indexing == | == Indexing == | ||
Revision as of 15:47, 19 August 2013
| (This article/section is incomplete, please check back again or help expanding it) |
This article describes how to analyze a single Laue image with LaueGo. It is assumed that the LaueGo Panel is already up in Igor, and the geometry and the crystal lattice are both set up correctly (See LaueGo#Basic Setup for instructions).
Loading and Displaying an Image
- First of all, select the "Index" tab on the LaueGo Panel, and if you see a button named "Init Indexing package", push it.
- To load an image to index, push the "Load Image" button, and select the image file that you want to analyze.
- The loaded image is stored in Igor as a "wave" with its name derived from the file name, and can be seen within Igor's "Data Browser" window.
- If an image window is closed, the data wave still exists in Igor. One can click the "View Image" botton on the LaueGo Panel to plot the image again.
Peak Search
Next step you need to identify the peak locations. Push the "Fit Peaks" button. This first asks what peak fitting algorithm that you wish to use. The first choice is "Fit Peaks with External" this uses the same C program that is used on the cluster. The other choices use algorithms built into Igor.
- The image is a list of available images that you can fit.
- The minimum allowed widht of a peak lets you set a minimum peak size. The 1.13 is fine for a Lorentzian, for a Gaussian peak use 0.2.
- The boxSize should be big enough to include any peak.
- The max R-factor should usualy be left at 0.5 unless you have very good or bad data.
- The peak shape may be Lorentzian or Gaussian, the Gaussian works best.
After the peak search has run, push button "±boxes" on topleft corner of the image plot. This button toggles the fitted peak boxes on/off.
If you don't like the peaks that were found (either too few or too many), you can edit the list of peaks. To remove a peak from consideration draw a marquee around the offending peak, click in side the marquee to bring up a pop-up menu, and select "Remove Peak from pkList". To add a peak for consideration, again draw a marquee around the desired peak, click in side the marquee to bring up a pop-up menu, and select "Add Gaussian to pkList". Clicking on the "±boxes" button toggles the boxes around all fitted peaks allowing you see which peaks are being used.
