Difference between revisions of "Single Laue Image Analysis with LaueGo"
m (→See Also) |
|||
| (4 intermediate revisions by the same user not shown) | |||
| Line 1: | Line 1: | ||
[[Image:Index tab.png|right|frame|A screenshot of the Index tab]] | |||
This article describes how to analyze a single Laue image with [[LaueGo]]. It is assumed that the LaueGo Panel is already up in [[IGOR Pro|Igor]], and the [[geometry parameters|geometry]] and the crystal lattice are both set up correctly (''See [[LaueGo#Basic Setup]] for instructions''). | This article describes how to analyze a single Laue image with [[LaueGo]]. It is assumed that the LaueGo Panel is already up in [[IGOR Pro|Igor]], and the [[geometry parameters|geometry]] and the crystal lattice are both set up correctly (''See [[LaueGo#Basic Setup]] for instructions''). | ||
| Line 8: | Line 7: | ||
* The loaded image is stored in Igor as a "wave" with its name derived from the file name, and can be seen within Igor's "Data Browser" window. | * The loaded image is stored in Igor as a "wave" with its name derived from the file name, and can be seen within Igor's "Data Browser" window. | ||
* If an image window is closed, the data wave still exists in Igor. One can click the "View Image" botton on the LaueGo Panel to plot the image again. | * If an image window is closed, the data wave still exists in Igor. One can click the "View Image" botton on the LaueGo Panel to plot the image again. | ||
<br clear=all> | |||
== Peak Search == | == Peak Search == | ||
[[Image:peak-fitting_dialogue.png|right]] | [[Image:peak-fitting_dialogue.png|right]] | ||
''See Also: [[PeakSearch Program]]'' | |||
Next step you need to identify the peak locations. Push the "Fit Peaks" button. This first asks what peak fitting algorithm that you wish to use. The first choice is "Fit Peaks with External" this uses the same C program that is used on the cluster. The other choices use algorithms built into Igor. | Next step you need to identify the peak locations. Push the "Fit Peaks" button. This first asks what peak fitting algorithm that you wish to use. The first choice is "Fit Peaks with External" this uses the same C program that is used on the cluster. The other choices use algorithms built into Igor. | ||
| Line 28: | Line 30: | ||
== Indexing == | == Indexing == | ||
[[Image:indexing dialogue.png|right]] | [[Image:indexing dialogue.png|right]] | ||
''See Also: [[Euler Program]]'' | |||
Now that the peaks have been found, you can index the pattern, use the "Index & Display" button, which puts up the indexing dialog. | Now that the peaks have been found, you can index the pattern, use the "Index & Display" button, which puts up the indexing dialog. | ||
| Line 36: | Line 40: | ||
Note, the indexing routine may find more than one pattern in the Laue picture. If that happens, then you will be able to view any one of the identified patterns. To view the result of an indexing on the image, select the pop list "hkl Tags...". This will allow you to see the result of the indexing, or view missing peaks. | Note, the indexing routine may find more than one pattern in the Laue picture. If that happens, then you will be able to view any one of the identified patterns. To view the result of an indexing on the image, select the pop list "hkl Tags...". This will allow you to see the result of the indexing, or view missing peaks. | ||
<br clear=all> | <br clear=all> | ||
== | == Reviewing Results == | ||
Now that you know the orientation of the sample, you can also get an oriented Stereographic Projection, or calculate the energy of any hkl. For a Stereographic Projection use the button (you may have to push it twice the first time). For the energy of an hkl, set the H,K,L, and push "Calc Energy of (hkl)". | Now that you know the orientation of the sample, you can also get an oriented Stereographic Projection, or calculate the energy of any hkl. For a Stereographic Projection use the button (you may have to push it twice the first time). For the energy of an hkl, set the H,K,L, and push "Calc Energy of (hkl)". | ||
You may also automatically produce a report sheet that shows the indexed Laue pattern and information about most of the peaks. Push the button labeled "Report", and print it. | You may also automatically produce a report sheet that shows the indexed Laue pattern and information about most of the peaks. Push the button labeled '''"Report"''', and print it. | ||
=== Mousing around === | |||
Once the Laue image has been indexed, you can get information about it using the mouse. | Once the Laue image has been indexed, you can get information about it using the mouse. | ||
| Line 49: | Line 54: | ||
== Strain Refinement == | == Strain Refinement == | ||
[[Image:strain_selection_dialog.png|right|frame]] | |||
Push the "Strain Refine" button after indexing is done. The strain dialog would appear. | |||
Select which parameters you want to refine and push "Go". Note that you cannot refine all three lengts (a,b, & c) since you have only collected angular information. The most you can get is the deviatoric strain. Since this program does not know the length of q vectors, when computing the strain it always preserves the volume of the unit cell when strain refinemening. | |||
<br clear=all> | |||
== See Also == | |||
* [[34ID-E Data Analysis Overview]] | |||
* [[LaueGo]] | |||
Latest revision as of 19:18, 21 August 2013
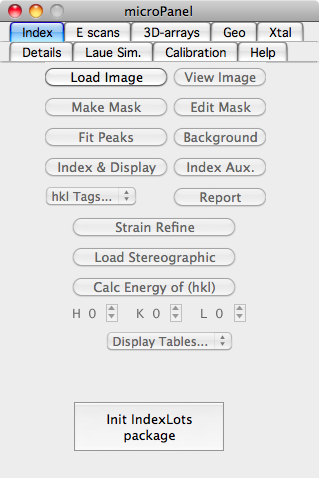
This article describes how to analyze a single Laue image with LaueGo. It is assumed that the LaueGo Panel is already up in Igor, and the geometry and the crystal lattice are both set up correctly (See LaueGo#Basic Setup for instructions).
Loading and Displaying an Image
- First of all, select the "Index" tab on the LaueGo Panel, and if you see a button named "Init Indexing package", push it.
- To load an image to index, push the "Load Image" button, and select the image file that you want to analyze.
- The loaded image is stored in Igor as a "wave" with its name derived from the file name, and can be seen within Igor's "Data Browser" window.
- If an image window is closed, the data wave still exists in Igor. One can click the "View Image" botton on the LaueGo Panel to plot the image again.
Peak Search
See Also: PeakSearch Program
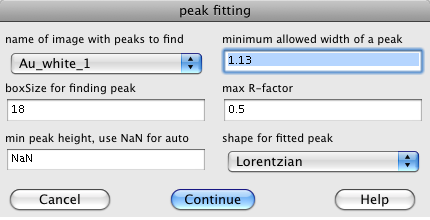
Next step you need to identify the peak locations. Push the "Fit Peaks" button. This first asks what peak fitting algorithm that you wish to use. The first choice is "Fit Peaks with External" this uses the same C program that is used on the cluster. The other choices use algorithms built into Igor.
The dialog for the "Fit Peaks with External" asks for the following parameters:
- The image is a list of available images that you can fit.
- The minimum allowed widht of a peak lets you set a minimum peak size. The 1.13 is fine for a Lorentzian, for a Gaussian peak use 0.2.
- The boxSize should be big enough to include any peak.
- The max R-factor should usualy be left at 0.5 unless you have very good or bad data.
- The peak shape may be Lorentzian or Gaussian, the Gaussian works best.
After the peak search has run, push button "±boxes" on topleft corner of the image plot. This button toggles the fitted peak boxes on/off.
If you don't like the peaks that were found (either too few or too many), you can edit the list of peaks. To remove a peak from consideration draw a marquee around the offending peak, click in side the marquee to bring up a pop-up menu, and select "Remove Peak from pkList". To add a peak for consideration, again draw a marquee around the desired peak, click in side the marquee to bring up a pop-up menu, and select "Add Gaussian to pkList". Clicking on the "±boxes" button toggles the boxes around all fitted peaks allowing you see which peaks are being used.
Indexing
See Also: Euler Program
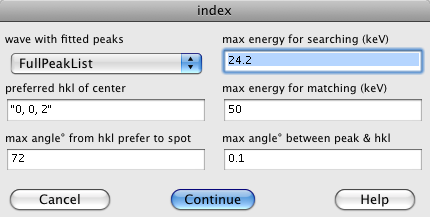
Now that the peaks have been found, you can index the pattern, use the "Index & Display" button, which puts up the indexing dialog.
The popup menu is a list of waves containing fitted peak positions, select the one you want. There will usually be only one choice.
The indexing algorithm constructs a list of possilble hkl's and compares the angles between the calcualted hkl's with the angles between measured q vectors. The list of hkl's is created using the "preferred hkl of center", "max angle° from hkl prefer", and "max energy for searcing" The "preferred hkl of center" and "max angle° from hkl prefer" specify a cone. All hkl in that cone are used, such that the Bragg reflection has an energy below the "max energy". There are two "max energy"s. The "max energy for searching" is used when finding the sample orientation. After the orientation is found, the "max energy for matching" is used to select which measured peaks belong to that pattern. So the "max energy for matching" should usualy be limited to 32 keV, and the "max energy for searching" should not be too big, or there will be too many hkl pairs to consider. The "max angle between peak & hkl" specifies the angular tolerance used when finding an orientation and when choosing which measured peaks are part of a pattern.
Note, the indexing routine may find more than one pattern in the Laue picture. If that happens, then you will be able to view any one of the identified patterns. To view the result of an indexing on the image, select the pop list "hkl Tags...". This will allow you to see the result of the indexing, or view missing peaks.
Reviewing Results
Now that you know the orientation of the sample, you can also get an oriented Stereographic Projection, or calculate the energy of any hkl. For a Stereographic Projection use the button (you may have to push it twice the first time). For the energy of an hkl, set the H,K,L, and push "Calc Energy of (hkl)".
You may also automatically produce a report sheet that shows the indexed Laue pattern and information about most of the peaks. Push the button labeled "Report", and print it.
Mousing around
Once the Laue image has been indexed, you can get information about it using the mouse.
- Info about indexed peaks: Hold down the Shift key and move the mouse over the plot.
- Info about fitted peaks: Hold down the Command (apple) key and move the mouse over the plot.
- Info about any location: Hold down the Command key and hold down the mouse while moving the mouse. This even works before you have indexed.
- Info about any Strain Refinement: Hold down the Shift & Command keys and mouse over the plot. This will only work after you have done a strain refinement.
Strain Refinement
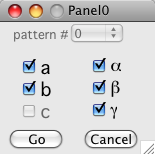
Push the "Strain Refine" button after indexing is done. The strain dialog would appear.
Select which parameters you want to refine and push "Go". Note that you cannot refine all three lengts (a,b, & c) since you have only collected angular information. The most you can get is the deviatoric strain. Since this program does not know the length of q vectors, when computing the strain it always preserves the volume of the unit cell when strain refinemening.


