Difference between revisions of "CMPR"
| Line 60: | Line 60: | ||
The Y-axis units or scaling can similarly be modified. Use "X-stagger %" and "Y-stagger %" to quickly create waterfall-style stacked plots for multiple datasets. (4) | The Y-axis units or scaling can similarly be modified. Use "X-stagger %" and "Y-stagger %" to quickly create waterfall-style stacked plots for multiple datasets. (4) | ||
Multiple files can easily be intensity normalized (to I = 1000), | Multiple files can easily be intensity normalized (to I = 1000). | ||
Note that rescalings are applied consecutively (so scaling x5, then x2 is equal to a single x10 rescale). To remove all applied user rescalings, tick the "reset" box (5), set all multipliers to 1 and offsets to 0, then click "Rescale". This returns all data to the original values. | |||
[[image:cmprReScaletab.png|500px|CMPR ReScale tab]] | [[image:cmprReScaletab.png|500px|CMPR ReScale tab]] | ||
Revision as of 16:11, 14 December 2011
About CMPR
CMPR is a free multipurpose program for powder diffraction data.
11-BM staff routinely use it to examine & compare (CoMPaRe) powder XRD data at the beamline. It is a handy tool for manipulating and converting multiple datasets, and can also be used to fit and index diffraction peaks.
The program works well with 11-BM's .fxye GSAS format, but can be used with nearly any powder XRD data.
See the CMPR subversion page for download links, installation notes, and full documentation. ( https://subversion.xor.aps.anl.gov/trac/CMPR/wiki)
Some of CMPR's basic features are described below.
Getting Started
CMPR Windows
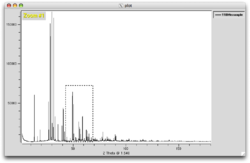
CMPR launches 2 windows: the main GUI Control window and the Plot window.
Functions on the Control window are organized into multiple menu tabs. For example, the Read new file tab is highlighted below. You may need to expand the GUI window to see all tabs at once.
Left-click with a mouse in the Plot window to define a zoom window, right-click to un-zoom. The key "L" shows/hides a cursor mode to read values from the plot window.
Opening files
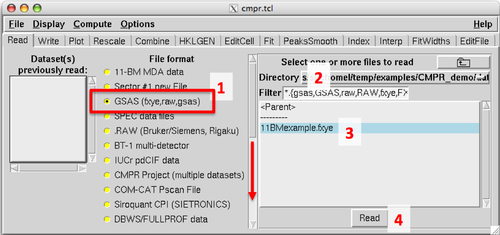
On the Read tab, first select the file format to be read (1). More formats can be found by scrolling down (red arrow). Navigate to the desired folder or directory (2). Select (hightlight) the file or files to be read (3). Click the READ button (4) to open the file(s).
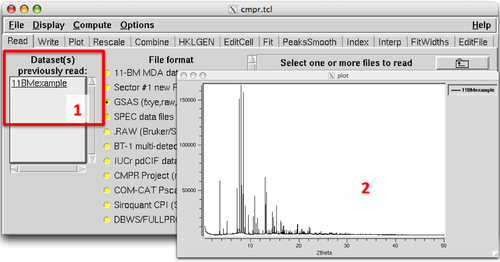
Successfully opened files will be listed in the "Datasets Read" panel (1) and will appear in the Plot window (2).
Plotting Data
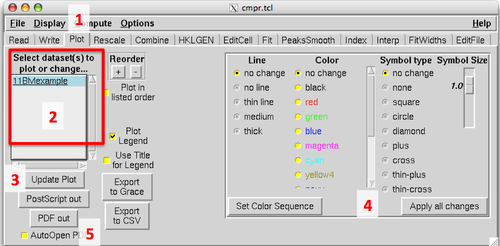
By default, the Plot window will display the most recently opened file(s). On the Plot tab of the Control window (1), modify which files are plotted. Highlight the desired file(s) (2), then click "Update Plot" (3).
One can also change the color or size of the data lines and markers (4). Select the desired files, then click "Set Sequence" or "Apply all Changes".
It is also possible to export the current Plot window contents to a pdf or postscipt image; or to Grace or .csv data outputs (5).
Data Manipulation
File Titles, Labels, and Wavelength
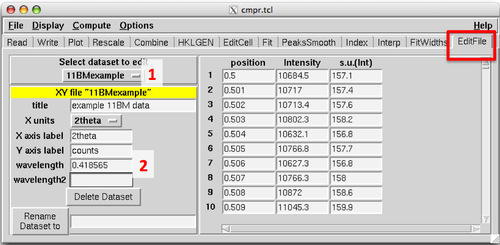
On the EditFile tab of the Control window, view and modify the titles, labels, and wavelength(s) for a selected dataset (1).
When opening certain data formats (like the 11-BM .fxye format), fields such as the wavelength (2) will be automatically read from the file header. For other formats, this information needs to be manually entered.
Rescaling & Data Conversion
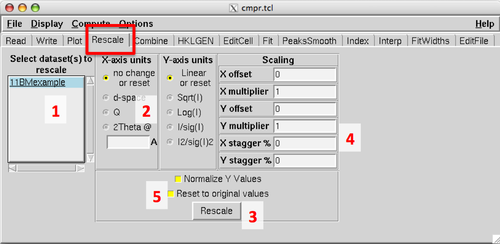
On the Rescale tab of the Control window one can change the X and/or Y scale units for selected file(s).
In addition to the "as collected" units, the X-axis for a dataset can be re-plotted in units of d-spacing, Q, or 2theta at different wavelength. Select the target file(s) (1), desired X-Units (2), then click "Rescale" (3). This conversion requires a wavelength in the 'EditFile' tab (see above), if no wavelength is found CMPR will prompt the user to enter a wavelength value.
The Y-axis units or scaling can similarly be modified. Use "X-stagger %" and "Y-stagger %" to quickly create waterfall-style stacked plots for multiple datasets. (4)
Multiple files can easily be intensity normalized (to I = 1000).
Note that rescalings are applied consecutively (so scaling x5, then x2 is equal to a single x10 rescale). To remove all applied user rescalings, tick the "reset" box (5), set all multipliers to 1 and offsets to 0, then click "Rescale". This returns all data to the original values.
Combining Data
On the Combine tab of the Control window, one can combine multiple datasets. One can add (times +1) or subtract (times -1) files. Note that files must have the same number of data points and scan range.
This is used at 11-BM to combine several identical scans into a single dataset with better counting statistics.
Saving Files
Write Data Tab
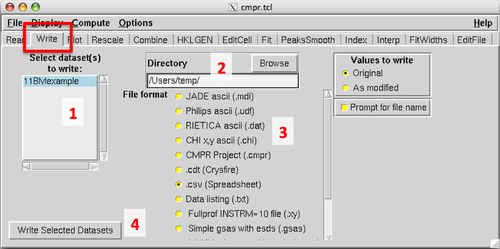
Convert original files to a new format, or save modified datasets on the Write tab of the Control window.
Select the file(s) to be saved (1) and target directory location for the saves file(s) (2). Next select the file format. (3) Scroll down to see all available formats. Then click "Write Selected Datasets" to write the files. (4) Note that is straightforward to add a new read or write format if desired (see full CMPR documentation for help here).
Advanced Topics
See the CMPR documentation for more information. (https://subversion.xor.aps.anl.gov/CMPR/trunk/doc/cmpr.html)
CMPR Citation
If you use CMPR in a project, please cite:
Toby, B. H. (2005). "CMPR - a powder diffraction toolkit," Journal of Applied Crystallography 38, 1040-1041.


