Difference between revisions of "GSAS Profile Terms"
| Line 84: | Line 84: | ||
encountered in powder specimens but is sometimes seen in | encountered in powder specimens but is sometimes seen in | ||
polycrystalline solid specimens such as pieces of metal. | polycrystalline solid specimens such as pieces of metal. | ||
== GSAS Refinement Hints == | |||
=== GSAS Profile 4 anisotropy Sxxx terms === | |||
Q: What is the "best" order for incorporating profile 4 anisotropy Sxxx terms into a refinement? | |||
A: from Robert Von Dreele (July 28, 2011) | |||
"Usually, I do the S4xx ones first & then the others. The thing is fairly stable after that. | |||
Do do all of them at once in any case in the end. The S4xx must be > 0 but the rest can be any sign. | |||
If you want a quick way of seeing the shape, run mustrplot (spelling?) in GSAS; | |||
you'll need gnuplot to see the plot. For monoclinics, it might look like two beans back-to-back." | |||
-Bob | |||
Revision as of 22:23, 4 January 2012
Peaks Profile terms for Rietveld Analysis
Most Rietveld refinement programs use a pseudo-Voigt term combining Gaussian and Lorentzian peak shapes (plus other correction terms). In general, the X-ray source can be described by a Gaussian function, while sample effects are described by Lorentzian terms.
For the synchrotron powder XRD data from 11-BM, the instrumental resolution is well described by Gaussian terms. Sample effects, such as size and microstrain broadening (i.e. local variations in the lattice parameters) are usually fit best by Lorentzian terms.
Please consult other references (such as the GSAS manual) for details on Rietveld profile functions.
11-BM Profile Fitting
Representative LaB6 data for 11-BM (high resolution powder XRD) can be downloaded from the 11-BM webpage here (pick your format):
Full details for the dataset collected in Feb. 2010 are as follows:
precise wavelength = 0.412235 A
data was collected on a spinning 0.8 mm diameter capillary of LaB6 660a
The NIST LaB6 660a SRM certificate lattice value = 4.15691(1) A.
The estimated muR (X-ray absorption) is ~ 1.0
collection temp: 295 K
2theta range: 0.5 deg - 50.0 deg
step size: 0.001 deg
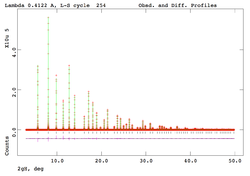
For the 11-BM dataset collected on LaB6 in Feb. 2010, the following parameters provide a good Rietveld fit using GSAS/EXPGUI:
space group: Pm-3m
a =  4.156917(1)
zero shift:  -0.00029 deg 2theta
La   @ 0, 0, 0 (Ui/Ue*100 =  0.62)
B  @  0.1984(1), 1/2, 1/2  (Ui/Ue*100 =  0.29)

GSAS Profile type 4:  (non-listed terms = 0.0)
Coeff.   :      GU        GV         GW          LX         S/L     H/L
Value    :  2.552E+00 -5.439E-01  5.990E-02   2.790E-01  1.2E-03  1.2E-03
background = 4-term Shifted Chebyschev (type #1)
Gives the following Rietveld fit statistics
wRp = 6.45%, Rp = 4.86%, CHI**2 = 3.349 (for 14 variables)
Image of fit plot is shown below (click to enlarge):
Conversion of pseudo-Voigt function terms
GSAS <-> Fullprof Gaussian Parameters GSAS Term <=> Fullprof Term : (description) GU = 1803.4 * U : (instrumental term, ~ tan^2 of theta) GV = 1803.4 * V : (instrumental term, ~ tan of theta) GW = 1803.4 * W : (instrumental term, ~ constant with theta) GP = 1803.4 * IG : (size broadening)
note: 1083.4 => centidegrees squared divided by 8*ln(2)
Lorentzian Parameters
GSAS Term <=> Fullprof Term : (description)
LX = 100 * Y : (size broadening)
LY = 100 * X : (microstrain)
note: 100 => degrees to centidegrees
Finger-Cox-Jephcoat asymmetry parameters
GSAS S/L = Fullprof S_L
GSAS H/L = Fullprof D_L
Note: terms are equivalent
S / L = the sample “half height”/diffractometer radius H / L = the slit half height/diffractometer radius
"Typical values of Rietveld instrument profile coefficients" Kaduk J, Reid J. Powder Diffraction (2011) vol. 26 pp. 88
size and microstrain broadening (i.e. local variations in the lattice parameters) are Lorentzian for 11-BM data
Only rarely is Gaussian size broadening observed; this re- quires a very tight monodisperse distribution, which is rarely encountered in powder specimens but is sometimes seen in polycrystalline solid specimens such as pieces of metal.
GSAS Refinement Hints
GSAS Profile 4 anisotropy Sxxx terms
Q: What is the "best" order for incorporating profile 4 anisotropy Sxxx terms into a refinement?

A: from Robert Von Dreele (July 28, 2011)
 "Usually, I do the S4xx ones first & then the others. The thing is fairly stable after that.
Do do all of them at once in any case  in the end. The S4xx must be > 0 but the rest can be any sign.
If you want a quick way of seeing the shape, run mustrplot (spelling?) in GSAS;
you'll need gnuplot to see the plot. For monoclinics, it might look like two beans back-to-back."
-Bob
