Difference between revisions of "34ID-E Coordinate Systems"
From 34-ID-E
Jump to navigationJump to search| (One intermediate revision by the same user not shown) | |||
| Line 21: | Line 21: | ||
== Detector Coordinates == | == Detector Coordinates == | ||
[[Image:Coordinates_beamline+detectors_3d.png| | [[Image:Coordinates_beamline+detectors_3d.png|thumb|330px|left|Figure A.]] | ||
[[Image:Coordinates_detectors.png|frame|right|Figure B.]] | [[Image:Coordinates_detectors.png|frame|right|Figure B.]] | ||
Figure A (left): A 3D cartoon showing detector image coordinates | '''Figure A''' (left): A 3D cartoon showing detector image coordinates together with the beamline XYZ coordinate system. | ||
Figure B (right): 2D diagram showing | '''Figure B''' (right): 2D diagram showing the "bottom view" (viewed from the sample spot) of the three detectors. This view also correspond to the relative positions between the three detector's images as they are displayed on the beamline computer monitors. | ||
<br clear=all> | <br clear=all> | ||
== Coordinate Systems in Data Analysis == | == Coordinate Systems in Data Analysis == | ||
{{incomplete}} | |||
When analyzing or displaying data in [[LaueGo]], one need to know the definitions of coordinate systems in these occasions: | |||
====In 2D/3D plotting==== | |||
====In strain refinements==== | |||
Latest revision as of 21:36, 18 October 2013
| (This article/section is incomplete, please check back again or help expanding it) |
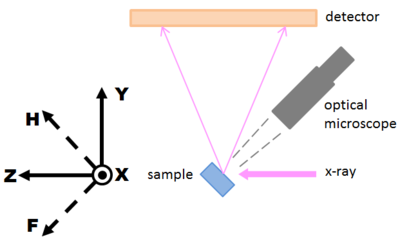
Beamline Coordinates
X-Y-Z
- X: radial direction of the ring, horizontal, pointing outboard to the doors.
- Y: vertically upward (against gravity).
- Z: along the x-ray beam
X-H-F
Because we routinely deal with motions in 45°-tilted directions, H and F are introduced as alternative coordinates to Y and Z:
- H: 45° upward-downstream (combination of +Y and +Z), this is the typical movement direction of the depth-profiling wire.
- F: 45° downward-downstream (combination of -Y and +Z), this is the "focus" direction of the sample under the optical microscope.
<math>H = \frac{1}{\sqrt{2}}(Y+Z)</math>
<math>F = \frac{1}{\sqrt{2}}(-Y+Z) </math>
Detector Coordinates
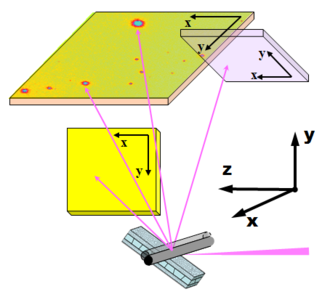
Figure A (left): A 3D cartoon showing detector image coordinates together with the beamline XYZ coordinate system.
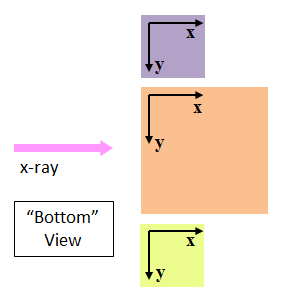
Figure B (right): 2D diagram showing the "bottom view" (viewed from the sample spot) of the three detectors. This view also correspond to the relative positions between the three detector's images as they are displayed on the beamline computer monitors.
Coordinate Systems in Data Analysis
| (This article/section is incomplete, please check back again or help expanding it) |
When analyzing or displaying data in LaueGo, one need to know the definitions of coordinate systems in these occasions:


